A song reaches college radio rotation when a station's DJs or music director choose to air it after it's submitted, and that choice becomes measurable once a logging platform records the spin; in the week of July 31–Aug. 6, 2026, Spinitron's own chart of its noncommercial station network shows Jack White's "Frozen Charlotte" leading with 303 logged spins, one snapshot of how that process plays out in real numbers.
How does a song get onto a college radio playlist in the first place?
Most submissions start with labels, publicists, or artists sending music directly to a station. Princeton's WPRB keeps an open "Music Submissions" channel on its site for exactly this purpose, alongside a running archive of "Recent Playlists" showing what's actually aired. That kind of open channel is common across noncommercial radio: a station's site works as both a public log and a mailbox for anyone trying to get a record heard.
What happens next depends on the station's programming model. Some stations run a music director who auditions new submissions and decides what joins a shared rotation list for DJs to draw from. Others lean toward decentralized DJ autonomy: WPRB's own site notes that new DJs need "no previous broadcasting experience," and its freeform hosts build their own sets rather than following a centralized add list. Either model produces airplay — but only one produces a formal rotation in the traditional sense, and knowing which model a given station runs matters for understanding why a song aired there at all.
What actually logs a song once it airs?
Most of that airplay gets recorded through dedicated software rather than a paper log. Spinitron describes itself as a platform used by more than 300 noncommercial stations, offering "playlist logging, reporting, web publishing, automation, push and much more." DJs enter or automate what's playing in real time as it spins, timestamped and attached to the station. Spinitron also describes itself as operating with DMCA safe-harbor protections as an online service provider for its member stations, a detail that points to how much infrastructure sits underneath what looks, from the listener's side, like a DJ simply cueing up a record.
That single design choice — logging every spin as structured data — is what turns radio, often thought of as ephemeral, into a searchable trail. A listener can look up what a specific show played weeks earlier; a publicist can confirm a track actually aired rather than just being added to a promo list. Without that log, a spin is a moment that passes; with it, the spin becomes a data point someone downstream can act on.
How do individual station plays turn into an industry chart?
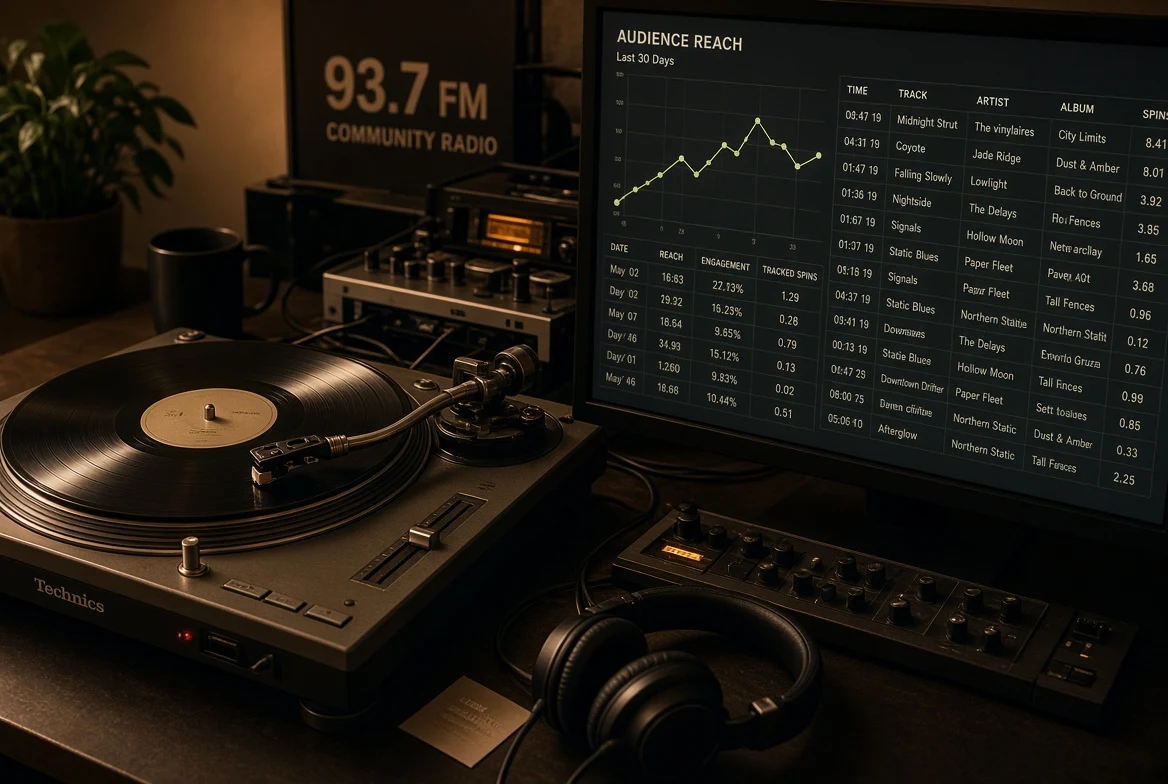
Once spins are logged, they can be aggregated. Spinitron compiles a chart across its affiliated station network, ranked by total spin count over a rolling week. The chart for July 31 through Aug. 6, 2026, runs 75 positions and tracks artist, song or album title, and genre for each entry; Jack White's "Frozen Charlotte" topped it at 303 spins, with Death Cab for Cutie's latest single close behind at 287. Every entry that far down the list represents dozens of individual DJs, at dozens of separate stations, independently choosing to spin the same track that week.
Not every station relies on a shared network chart, though. Some compile their own from in-house data. KALX, the University of California, Berkeley's station, publishes a "Top 100 Albums of the Month" and a "Top 35 Albums of the Week" pulled from what its own DJs are logging — a station-level view rather than a network-wide one. That distinction matters: a station-specific chart reflects one community's taste, while a network chart like Spinitron's aggregates dozens of communities into a single ranking.
Who actually reads these charts, and why do they matter for discovery?
Labels, publicists, and press track them closely. WPRB explicitly offers a "Receive Monthly Charts" subscription on its site, aimed at exactly that audience. Because the numbers come from logged, timestamped spins rather than sales or streaming totals, they surface something different: what a specific community of station DJs is actually choosing to put on the air, week over week.
That's the part worth sitting with. A streaming chart reflects what an algorithm surfaces to millions of individual listeners. A station spin chart reflects a smaller, more deliberate set of choices — a DJ or music director deciding a song belongs on the air, logged one spin at a time. It's a slower signal, but often an earlier one, which is why labels and press still watch it before a record shows up anywhere else. For a listener, the same mechanism doubles as a discovery tool: a station or network chart is, in effect, a list of what real programmers are choosing right now, filtered through neither an algorithm nor a marketing budget.
Frequently asked questions
Does every college or community station use Spinitron?
No. Spinitron describes its network as more than 300 noncommercial stations, but that leaves many outside it. Some, like WPRB, maintain their own playlist archives and chart-subscription systems separately rather than through Spinitron's shared network.
Are all college radio charts based on spin counts?
The two examples here both are: Spinitron's network chart ranks tracks by total logged spins over a week, and KALX's monthly and weekly album charts are built from its own DJs' logged plays rather than sales or streaming figures.
Can any artist or label submit music to a college station?
At stations like WPRB, yes — the station keeps an open submissions channel on its site for labels, publicists, and artists. What happens after submission, whether it's added to rotation or picked up by an individual DJ, varies by station.